View and analyze the data of your experiments
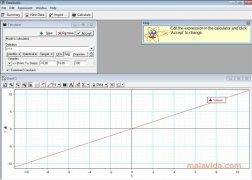
When we carry out many lab tests, everything ends up working out on the corresponding graphs and equations. It doesn't matter if its electronics, physics or pure maths, all the data ends up being able to be represented by means of DataStudio.
Analyze the data obtained from experiments and tests
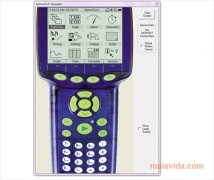
This software will work as a graphic representer, notepad, meter, display, FFT, oscilloscope or histogram, and all this based on the data that we present to it by means of summary files or connecting one of the peripheral machines that it's compatible with.
Furthermore, students can include their predictions so as to compare them later with the real measurements, something that's really interesting to compare models.
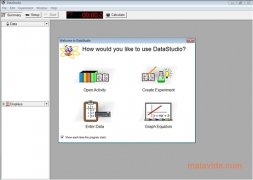
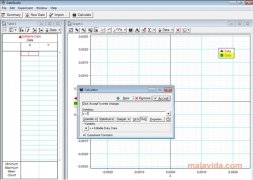
The software has an interface that its potential users will know how to make the most of because it maximizes as much as possible the visualization of the data that it has compiled, and it allows both its modification as well as its analysis.
Like in any real device, this virtual system allows all kinds of adjustment to make sure that the data is viewed properly, furthermore, it's possible to eliminate all the elements from the interface with the intention of carrying out screen captures that can be published through specialized media or included in university projects.
Requirements and additional information:
- This download requires a ZIP compatible compressor.
- The trial version can be used for 90 days.
 Leticia Sorivella
My name is Leticia. I really like movies, television, and music. That is why I studied Audiovisual Communication. In the beginning, I wanted to work in movies, but I ended up on television. Then, I went from being behind the cameras to being in...

Antony Peel


