Powerful program to generate tables and 2D graphs
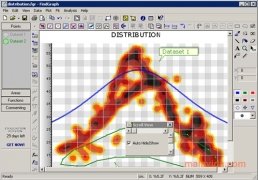
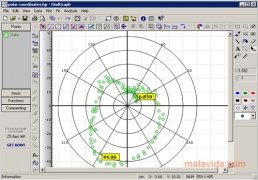
If you are an engineer, scientist, or simply a student in search of a tool to view your calculations as a 2D model graph, you are in the right place. FindGraph will make sure that the results of your calculations are quickly represented on the screen.
Generate all sorts of maths charts
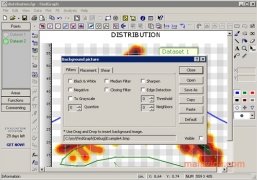
Generally, we need to view data from different sources like Internet Web Pages, text files, Excel tables or raw data in graphic format, and to do so, FindGraph will help us in the task. We will also be able to program the function according to any of the supported languages.
We will be able to add text, colors, and formats to the resulting graphs, it is also possible to work with different colors depending on the representation, add formulas to automatically generate the results and all the things that a professional so that his graphs are perfect.
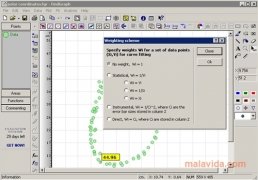
What's more, when we have the calculation expressed as a graph we will be able to modify it by taking away points, zoom in to determine results in specific zones or save the results depending on the standards of the sector or even in ASCII.
Requirements and additional information:
- The trial period lasts for 30 days.
 Leticia Sorivella
My name is Leticia. I really like movies, television, and music. That is why I studied Audiovisual Communication. In the beginning, I wanted to work in movies, but I ended up on television. Then, I went from being behind the cameras to being in...

Scott McLure


